
Customer support metrics for a small business only earn their keep if they change something you do next week. A dashboard with forty charts produces a feeling of control and very few decisions. For a store or a service business, five or six numbers read once a week are enough: how fast the first reply arrives, how many conversations end resolved, how many visitors leave a way to reach them, and where and in what language people are writing from. This guide covers what each of those means in the ConvertPilot console, what each one hides, and the short routine that turns them into action.
The analytics screen sits in Settings and covers the last 30 days. It is on the Premium and Enterprise plans. The plan table lists it as “Analytics dashboard”, and the settings description lists what it holds: conversations, resolution, response times, daily activity, countries, languages, devices and sentiment.
The six numbers at the top of the screen
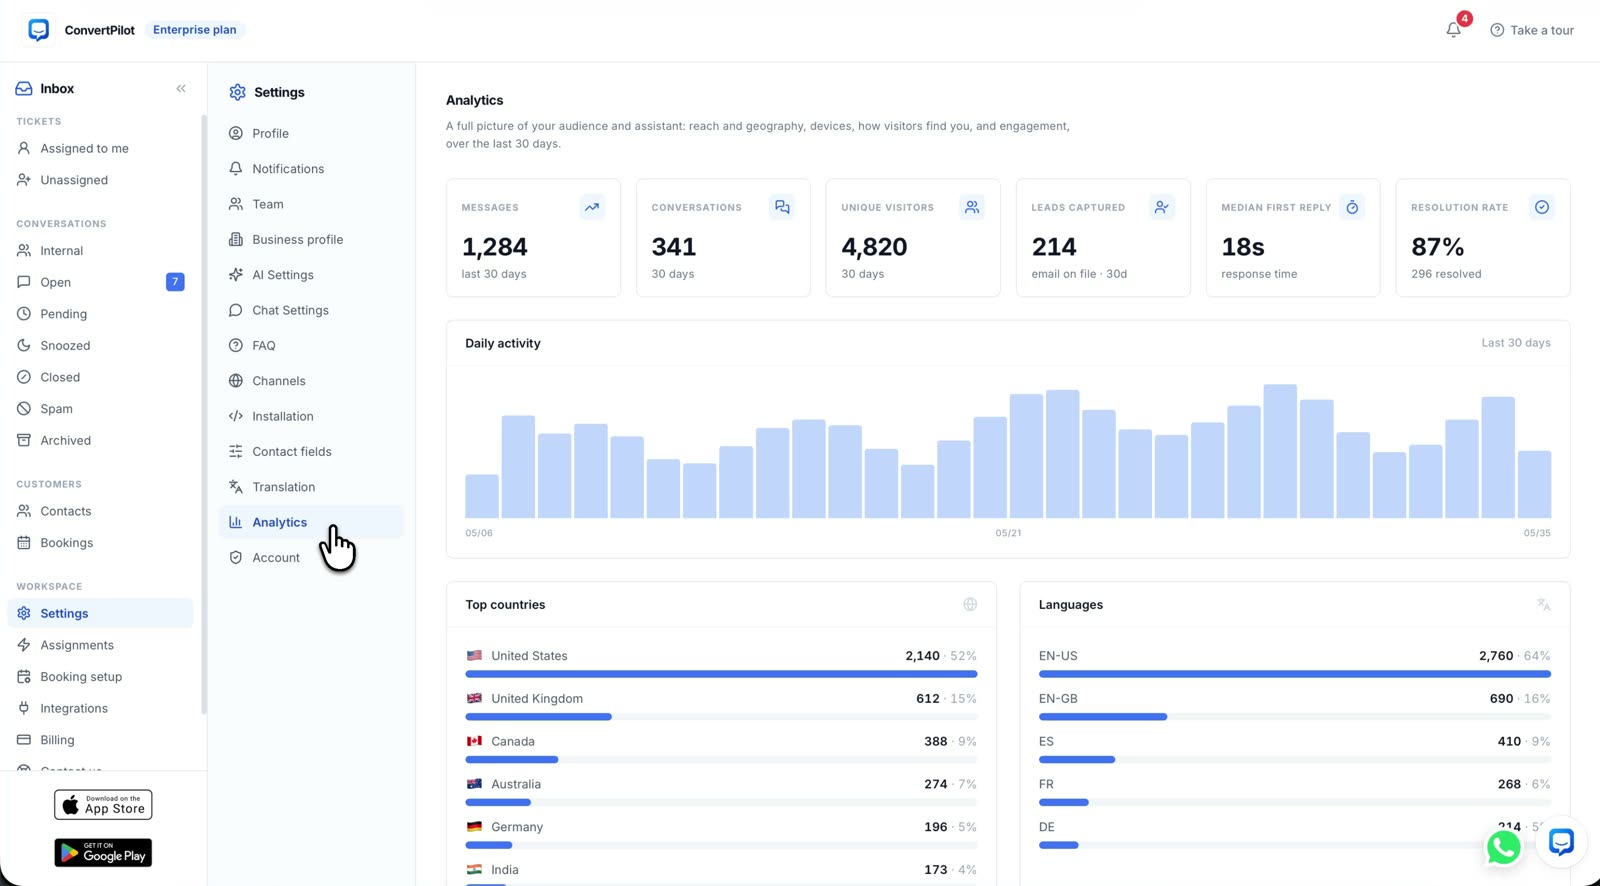
The tour clip shows six tiles across the top, each over the last 30 days. The values in the clip are from the demo workspace; the table describes what each tile counts.
| Tile | What it counts | What it does not tell you |
|---|---|---|
| Messages | Every message in the period, from customers and replies | Whether the volume is questions or the same question asked many times |
| Conversations | Threads, however many messages each holds | How hard they were; ten short ones and one long dispute look the same |
| Unique visitors | People who reached the chat in the period | How many of them needed help rather than browsing |
| Leads captured | Contacts with an email on file in the period | Whether they were buyers or people asking where their parcel is |
| Median first reply | The middle value of time to the first response | The slow tail; a few very late replies barely move a median |
| Resolution rate | The share of conversations counted as resolved, with the count beside it | Whether the customer agreed it was resolved |
First reply time: why the median, and what it hides
The console reports the median first reply rather than the average. A median is the middle value: half of first replies were faster, half slower. That is the right choice when the agent answers most messages in seconds and a person picks up the rest, because one reply sent the next morning would drag an average far away from what most customers saw.
The cost of a median is that it hides the tail. A median of a few seconds can sit on top of a handful of customers who waited until the next day because their question needed a person and nobody was online. Those are the conversations that turn into reviews. The fix is not on the analytics screen; it is in your Online hours and your handoff rules, and in the Pending view of the inbox where the waiting conversations are. How the agent passes a conversation to a person, and what it tells the customer while they wait, is covered in handing a chat to a person.
A fast median with a slow tail is the most common shape for an inbox with an AI agent in front. Read the median for the agent and the Pending queue for your team.
Resolution rate is a decision, not a fact
The screen shows the rate and the count; it does not define resolved for you, and closing habits differ from team to team. That makes resolution rate a measure of how your team closes threads as much as how well customers were helped. Two stores with identical service can show very different rates if one closes conversations at the end of every shift and the other leaves them open in case the customer comes back.
- Agree what resolved means. Write it down: the question was answered, the order issue has a next step, the customer has stopped replying for a set time. Then hold everyone to it.
- Read the count, not just the percentage. The tile shows the number of resolved conversations beside the rate. A rising rate on falling volume is not an improvement.
- Check the reopened ones. A conversation that reopens a day later was not resolved, whatever the tile said.
- Trace the agent’s answers when the rate moves. If resolution drops after a product change, open a few AI replies and use Why this reply to see which source or rule they relied on.
Leads, countries and languages: the numbers that change your setup
Leads captured counts contacts with an email on file. For a store this is the number that connects the inbox to marketing, and on Premium the same plan includes the Klaviyo, HubSpot, Mailchimp, Salesforce, Slack and Zapier integrations. How AI tagging can send the right contacts into the right list is set out in AI tagging for Klaviyo and HubSpot.
Countries and languages are the two panels most likely to change how you run support. If a meaningful share of conversations arrive in a language you did not plan for, that is a reason to check the translation settings and the knowledge the agent answers from in that language. If a country appears that sits several time zones away, your Online hours may be covering nobody when its customers are awake. Neither change needs a new tool; both need someone to read the panel.
Sentiment and devices complete the picture. Sentiment is read from the conversations themselves, so treat it as a trend to watch rather than a score customers gave you. Devices matter mainly for one question: whether most of your chats come from phones, in which case the widget and your answers should be written to be read on one.
A fifteen-minute weekly routine
- Open the analytics screen and note the six tiles. Write them in one row of a sheet each week. The trend is worth more than any single value.
- Look at daily activity. Find the busiest days and compare them with your Online hours and staff rota.
- Open the Pending view. Count conversations that waited more than a working day. That number is the tail the median hides.
- Read five conversations end to end. Two resolved, two that went to a person, one with negative sentiment. Fix the source or the rule behind anything wrong.
- Check countries and languages. If either moved, check translation and hours before the next busy week.
That is the whole review. It fits in a Monday morning, and it turns the dashboard from a report into a list of two or three changes. The full feature set, including where analytics sits alongside the inbox, Training and handoff, is on the features page, and the plans that include the analytics dashboard are on the pricing page.